What Are the Tricky Parts of Embedded Development?
In the first post in the tricky parts of embedded systems series, I introduced an Internet of Things Light proof of concept. By the end, I’d talked about combining the building blocks of off-the-shelf LEDs and a BLE module. The resulting project did all the product was supposed to do, but the journey to shipping hadn’t quite started. Then there was ominous music because I hadn’t started on the actual tricky parts of embedded systems.
When building an embedded systems product, there are many pieces of embedded-specific education that you might need. These are things that can be learned in school and books, that have a theory and a canonical solution. I don’t think of them as tricky, things like:
What’s all this stuff in the datasheet?
What’s a register?
Why do PWMs require two timers?
When do you use interrupts and how are they called?
What is a race condition?
What do you do about priority inversion?
How exactly does one twiddle bits?
To learn this sorts of definitional information, there are resources out there for you.
I, of course, like my book, Making Embedded Systems. I hope you do too. You’ll see a few images from it in the slides. But there are other resources that will teach you the essential information you need to know: books, classes, blogs, and so on.
I think the tricky parts of embedded systems are debugging, downloading firmware, dealing with resource constraints, other people, and innately hard problems.
Debugging
Embedded systems are difficult to debug, far more than desktop systems. Remember, they are purpose built for their application (and, sadly, their application is not to be debugged).
If you don’t design a system to be able to be debugged, you may build hardware you can’t make work, that you can’t even program. By their nature, firmware iterations take longer than software. Hardware iterations take longer than both combined, by a lot. Planning is required.
With our IoT Light proof of concept, we had all these boards wired together so we could look at what each component did on their own. But once you have a custom board with the components soldered on, you don’t get access to that level of communication information anymore (unless you plan ahead). Adding electronic test points are the obvious answer but that isn’t nearly enough.
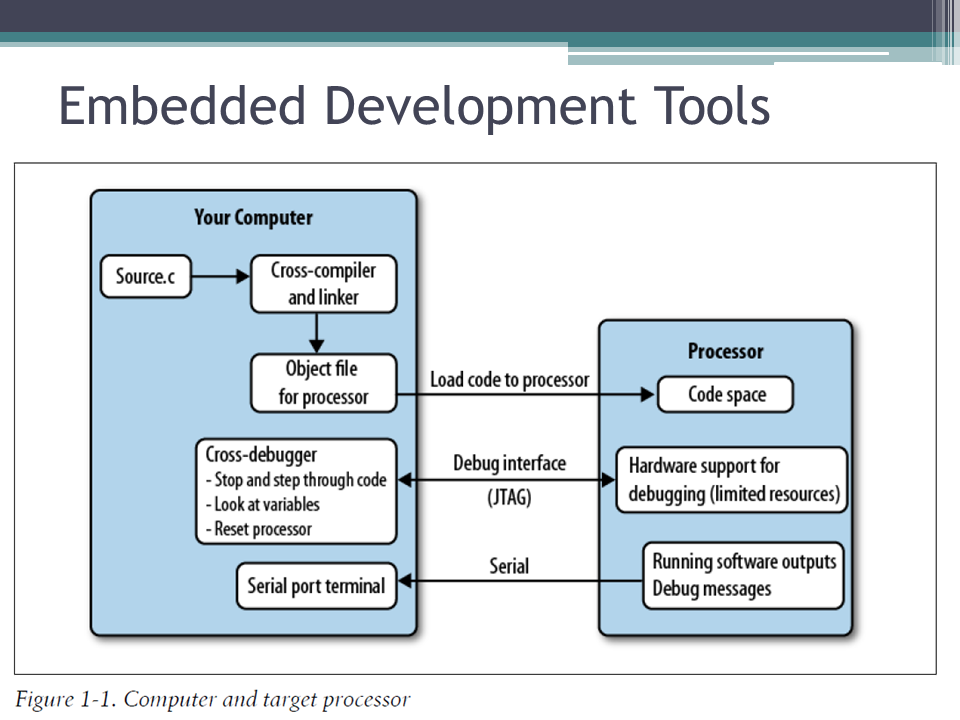
Almost all embedded software is cross-compiled: compiled on one computer then the executable is downloaded to the device through a programmer. Programmers can be cheap and put your code into the flash memory, or they can be more robust allowing you to step through the code, or even better, let you trace through and profile your code. Debugging is often not done in a modern IDE, with breakpoints and watch variables everywhere. You may have only a few breakpoints so you have to choose carefully where you put them.
If you have an RTOS on your processor, like we do on the Nordic, a breakpoint may cause timing errors in the operating system, causing it to crash. I’m going to make fun of Nordic in this series, but I like their chips just fine: the problems they have happen across the industry in one form or another.
Our proof of concept was probably created using a free compiler, probably mBed because OSHChip has a getting started guide for it or Keil’s size-limited version. The Nordic SDK examples are in written using the Keil compiler. Nordic’s tutorials and most of their forum information are written assuming you are using Windows and Keil.
The mBed online compiler is created and supported by ARM. It is neat and has a great community. But it isn’t the compiler that Nordic works with to create their example code. At best, there's a delay while code is ported and tutorials expanded. Usually, it is the community (ahem, you!) that ends up porting the example code. Also, the mBed compiler is online, something that often makes people a little nervous about relying on it. Once you see Keil’s per-seat license price, you start thinking that an open source compiler like GCC seems like such a good idea. There are people who talk about it working.
Image by Elizabeth Brenner, used with permission.
I hate paying high prices for compilers of dubious quality and I had a nice looking, more functional desktop IDE in 1998. However, unless you have a large team, use the compiler system recommended by your processor vendor. Otherwise, you may pay a high price trying to figure out why it doesn’t work: some combination of linker file, processor configuration, assembly dialect differences in the startup file, compiler specific pragmas and pixie dust.
If you really must go free, try mBed or PlatformIO before GCC. The more mature your processor is, the more likely one of these free and embedded-targeted options will work.
Overall, buy the best tools you can afford, your time is precious and debugging can be painful. This applies to both hardware and software tools.
Testing
Of course, you could be quite sensible and do test driven development. Then you have to choose between running on the target processor or running them offline. On the target, you have access to hardware components and peripherals, but iterations are slower. Offline is faster but less similar to the real system and requires more mocks for fake hardware. Both is probably the correct option. Though doing both forms of testing can seem like we are adding one more thing, one more barrier, to an already laborious process of edit-compile-download-run.
The code deployment cycle can be a only few minutes, but it makes iterating that much more painful. On one hand, that is good because I’ll think more about how to fix a bug instead of trying all of the available options. On the other hand, it is easy for me to break my mental flow with email in those few minutes between trying to fix something and testing it so I forget what I was doing.
Modern operating systems and languages give you fine grained visibility into what functions are being called and what resources are being used. Embedded systems don’t have that. The lack of visibility is a difficult problem. One of your challenges will be to figure out if your bug is hardware or software. For that, you need to be able to see what is happening. There are a few tools to help you.
A multimeter, usually a digital multimeter (DMM), will read voltages to verify the board’s subsystems have power. In ohmmeter mode, a DMM will help you verify connections between two points, checking cables or traces for continuity (beep mode). Even a cheap voltmeter is pretty good for static signals.
An oscilloscope shows how monitored signals change with time. It lets you see that the pin that your code is setting on your processor isn’t actually moving as much as you expected, then trace down to figure out why.
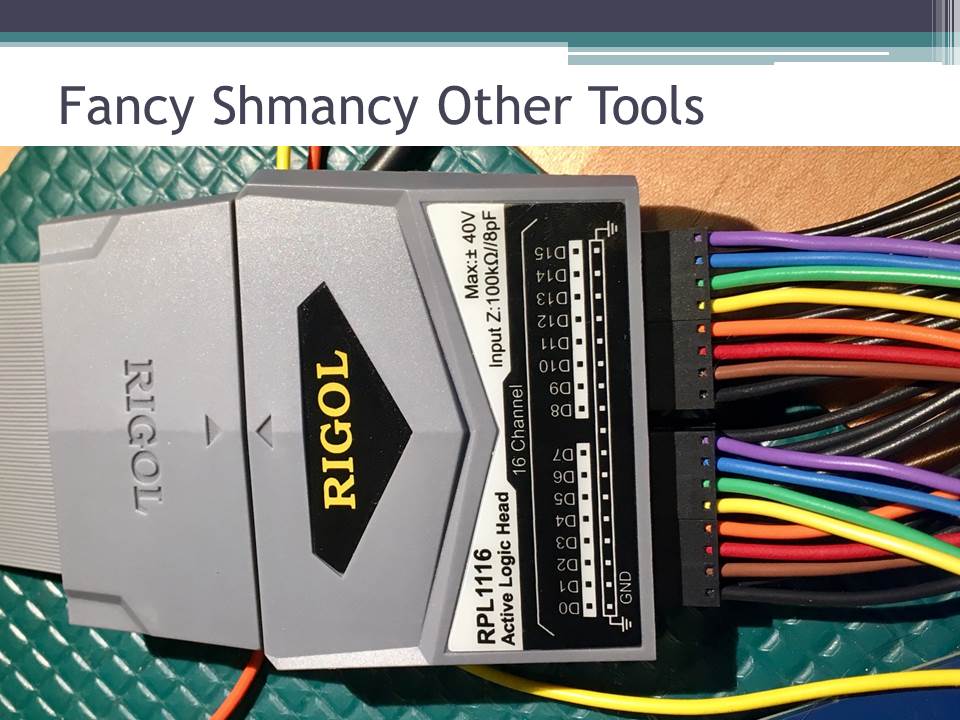
A logic analyzer does similar measurement but for many digital signals (an oscilloscope does 2 to 4 analog signals). A logic analyzer is great at figuring out why a serial port or other communication method isn’t working.
All of these tools are useful only if you use them. Sometimes you have to acknowledge you aren’t going to demystify a bug by typing at it. Setting up a logic analyzer or scope takes time so typing feel faster even if you get a correct, better, answer from the scope about what’s actually going on.
Even as an expert software engineer, you have to learn how to use these tools: read their manuals, watch a few youtube videos, etc. The interfaces aren’t obvious: how and when and where to ground can occasionally cause an argument among experienced electrical engineers.
Of course, you have to make sure the signals are available on your custom board. During the design review, you have to say some magic words to make sure you can see the signals: “where are my debug test points?” It goes along with learning to read a schematic, another thing you’ll need to learn, tedious but not tricky. It’s just another shorthand. (Oh, and if you don’t get test points, ask if there is going to be room to attach test wires to the chips. That should scare the designer into adding test points.)
Speaking of schematics, a very hardware oriented thing, note that the bare board on your desk is not the same as a computer. Even for large scale consumer manufacturing, the initial engineering boards tend to be expensive and rare. We often have only a few to start with and they are so fragile. It can lose its magic smoke in many ways (including my favorites: putting it on a metal surface which shorts its connections and/or spilling coffee on it). But you don’t need to physically damage it to make it non-functional. Depending on the design, there are ways to destroy your board through software: locking the flash so it cannot be rewritten, accidentally repeatedly rewriting flash until it gets destroyed, enabling power at the wrong time, draining the battery too low, and bugs in the bootloaders.
Returning to our IoT Light example, you can see the connections between the processors, their programmers, and their compilers. If you think about test points in this diagram, everything that goes to the ATTiny is a candidate for a test point. For the UART’s two lines, we can use a logic analyzer to peek into what the two processors are saying to each other. The line the ATTiny uses to control the LEDs will be interesting on an oscilloscope. (Those SPI lines going to the programmer will feature later.)
Looking at the block diagram, we still can’t see what is happening inside the Nordic chip. We have a debugger but the RTOS makes it of limited utility. When BLE is working, we can send information to the receiving app for debugging. However, that “BLE is working” caveat may be exactly what we are debugging. I would normally suggest adding a serial port from the Nordic to your computer for debugging but the processor only has one and we are already using it.
This lack of visibility is a big risk to the whole project. It is why debugging is on my list of tricky things.
In embedded systems, debugging is something you have to plan for and think about. With the Nordic, my solution is to add some GPIO test points that can be use to signal the state of the system; essentially, I use all the GPIO lines we have left. If everything goes horribly wrong, it is possible to send ourselves messages with one GPIO line and Morse code.
Another way to relieve the lack of debuggability is to make thorough tests that can run (and be walked through in the IDE) before the RTOS begins. We can verify the processor outputs, including verifying communications with the ATTiny, all the crucial parts before the RTOS steals our ability to use the precious breakpoints. It is a good case for writing tests for the code.
With the ATTiny, we don’t have even the ability to walk through the code as it has no debugger port. On the other hand, the processor has another UART that we can use for debugging. I can even add something to the interprocessor communication, to get debug output from the Nordic, a passthrough logging subsystem. This is dangerous: we’re talking about making both processors work to send pointless messages to myself, wasting cycles, RAM and flash. It will change the timing of the system.
But it means we can debug. We don’t have to use it but if we ask for the pins to be brought out on the board, the possibility is available later if we desperately need it. Does that add a lot of complexity to the hardware?
That’s starting to look more like a schematic. It isn’t quite there, but you can see where it is headed. Our system got quite a bit more complex, going from the off-the-shelf development boards to a custom board. I added some debug GPIOs and some identifier GPIOs so the Nordic firmware can tell which hardware revision it is running on. I added a battery monitoring and charging subsystem so we don’t blow up the battery. There is a power button so the system can go into a power off mode during shipping then be woken up by the user.
Speaking of power, with our proof of concept, we might have gotten away with driving the LEDs with 3.3V but they are a 5V part. We need a voltage level shifter or we will seriously regret it.
Also, now the SPI lines to program the ATTiny go to the Nordic, that will be important when we download firmware, the second in my list of tricky parts of embedded systems.
This blog post is part of a series based on the “Embedded Systems: The Tricky Parts” talk I gave to the Silicon Valley IEEE Computer Society. A video of the talk is available on YouTube.


